![]()
![]()
![]()
R package for nowcasting with non-cumulative chain-ladder method.
- 1 main nowcast function
-
nowcast_cl()returns object with all intermediary results
-
- 4 plots
-
plot_nc_input(option = "triangle")/plot(which = "data", option = "triangle") -
plot_nc_input(option = "millipede")/plot(which = "data", option = "millipede") -
plot_delays()/plot(which = "delays") -
plot_nowcast()/plot(which = "results")
-
- 3 utility functions
-
calculate_retro_score(): Calculate retro-scores for all groups -
rm_repeated_values(): Remove duplicated reported values in reporting matrix -
fill_future_reported_values(): Fill future reported values with last known values
-
- Accuracy Evaluation
-
nowcast_eval(): perform evaluation -
plot_nowcast_eval(): plot main eval results -
plot_nowcast_eval_by_delay(): plot eval results by delay -
plot_nowcast_eval_detail(): plot detailed eval results
-
Installation
## install from GitHub
pak::pak("whocov/nowcastr") # recommended, more up to date versions

## install from CRAN
install.packages("nowcastr")
Quick Start
library(nowcastr)
## Get your data
nc_data <- nowcast_demo
## Plot input data
nc_data %>%
plot_nc_input(
option = "triangle", # or "millipede"
col_date_occurrence = date_occurrence,
col_date_reporting = date_report,
col_value = value,
group_cols = "group"
)
## Run nowcast with built-in demo data
nc_obj <- nc_data %>%
nowcast_cl(
max_delay = 5, # optional
max_reportunits = 8, # optional
col_date_occurrence = date_occurrence,
col_date_reporting = date_report,
col_value = value,
group_cols = "group",
time_units = "weeks",
do_model_fitting = TRUE
)
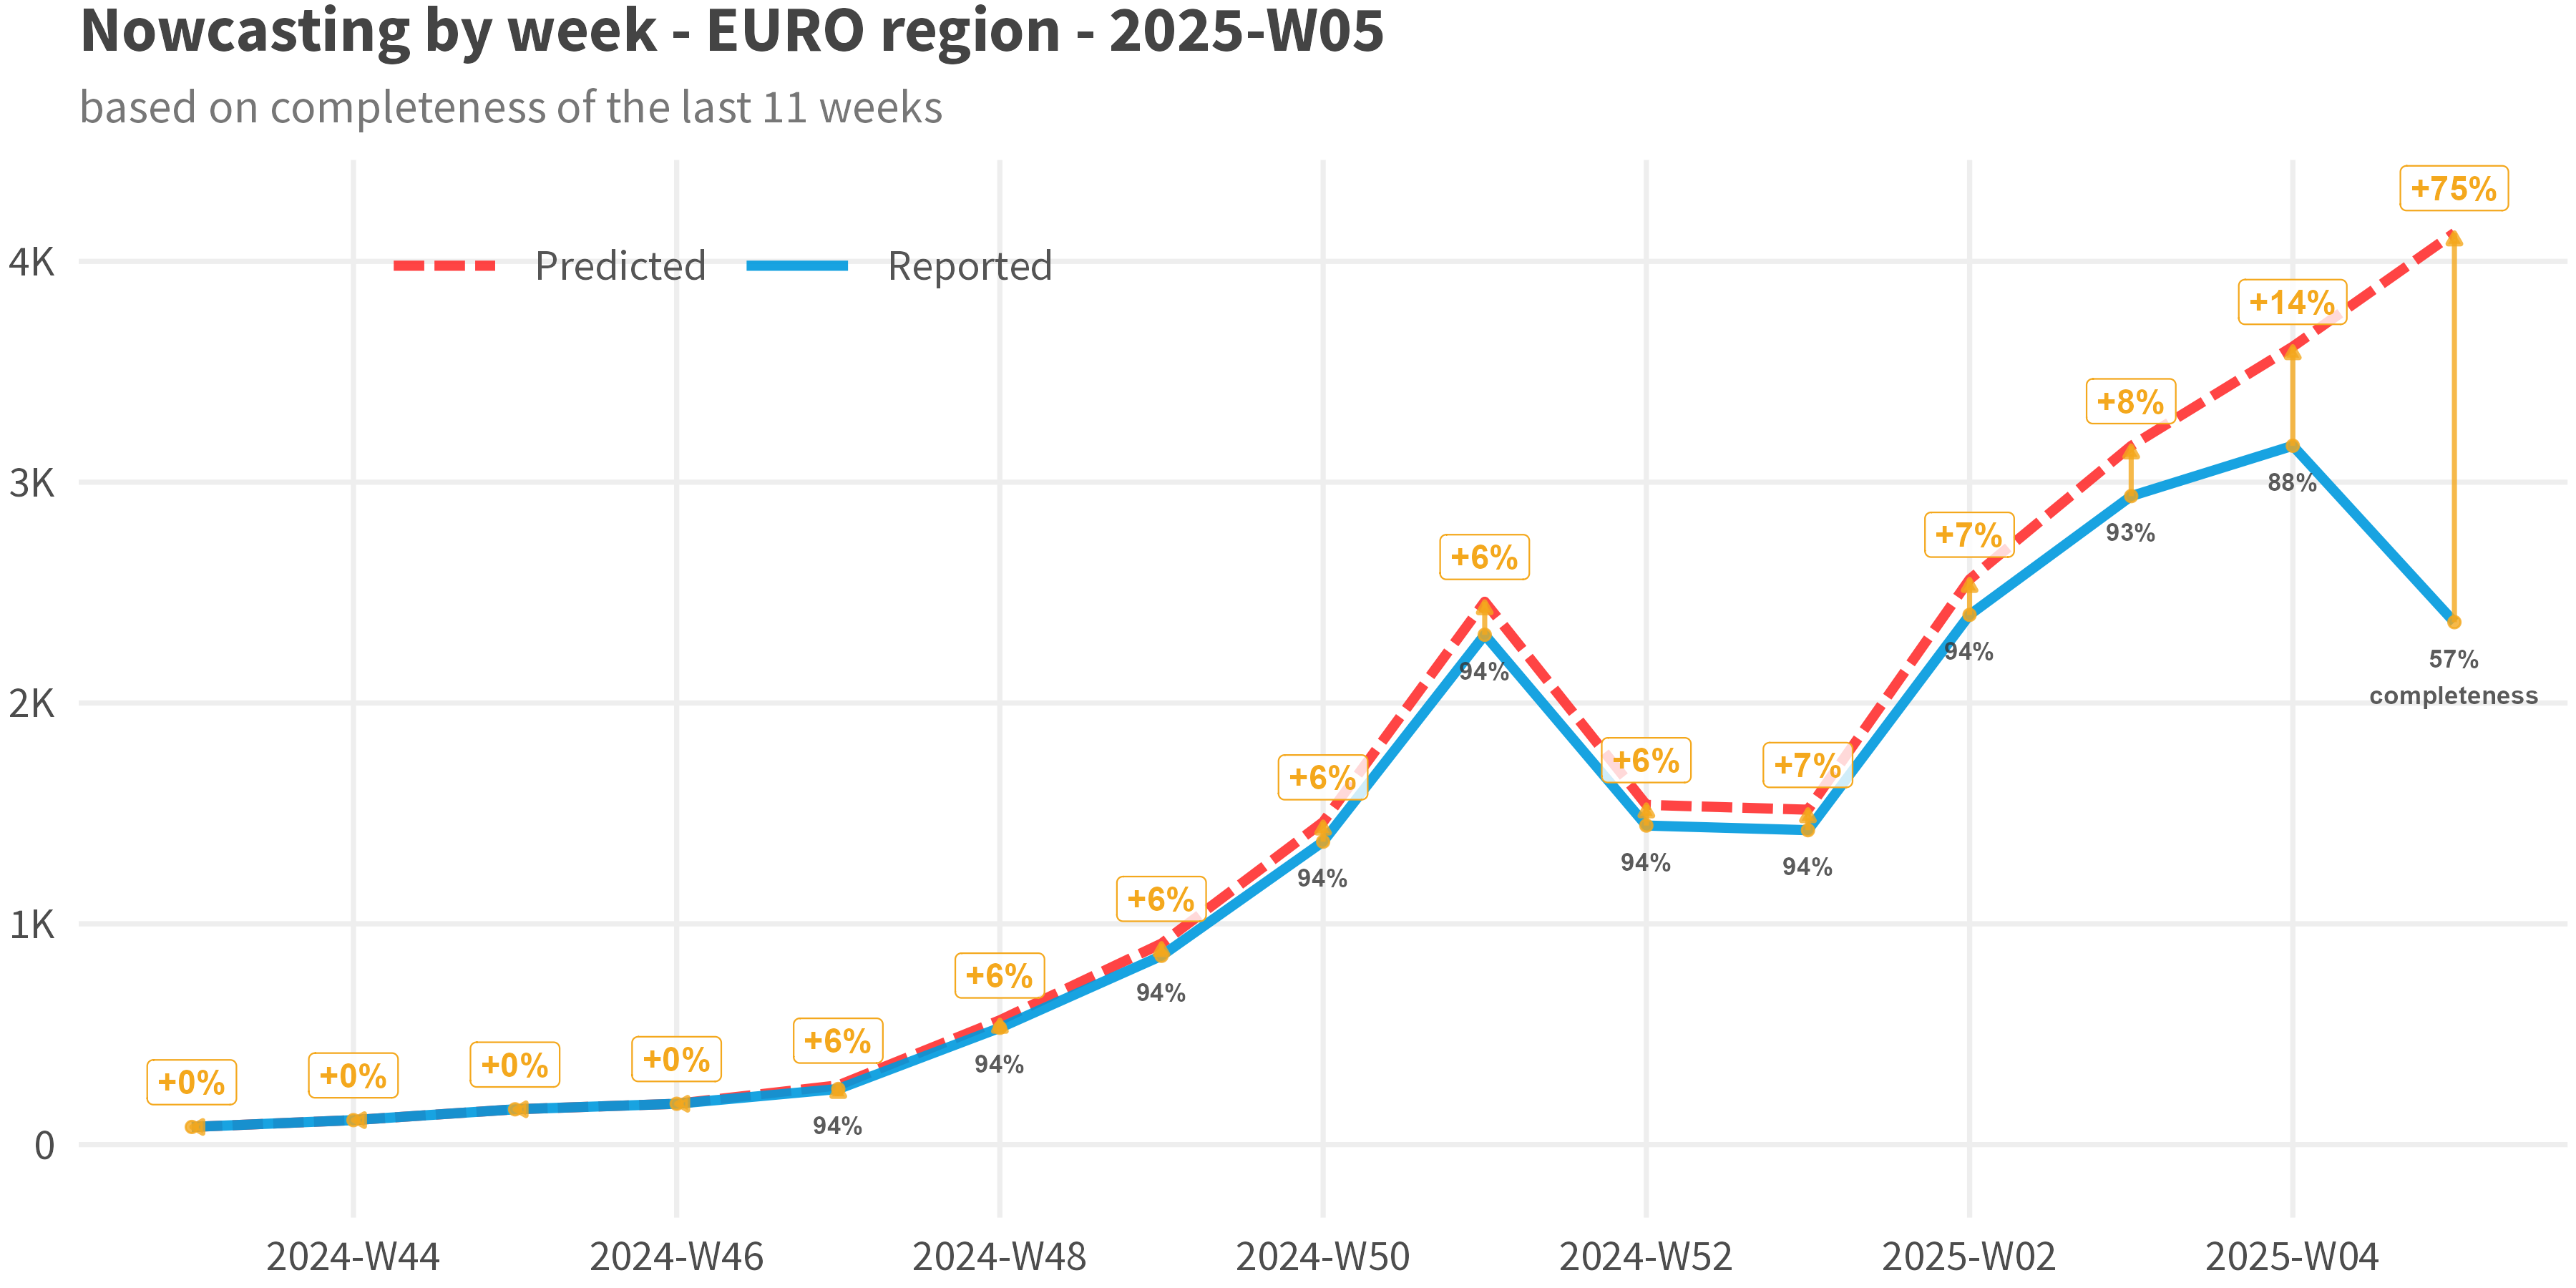
## Plot nowcasted time series
plot(nc_obj, which = "results")
print(nc_obj@results) # inspect data frame
## Plot delay distribution
plot(nc_obj, which = "delays")
print(nc_obj@delays) # inspect data frameMore detailed examples are available in the Getting started vignette.
Data Requirements
Dataset with at least 2 date columns and a value column. The dataset can also have multiple group-by columns for batch processing.
Note that the delays (difference between the 2 dates) should have constant intervals, i.e., multiples of 1 day or 7 days.
dplyr::glimpse(nowcast_demo, 70)

# Rows: 1,624
# Columns: 4
# $ value           <dbl> 251563, 219818, 219815, 253451, 253454, 3116…
# $ date_occurrence <date> 2024-12-16, 2024-12-23, 2024-12-23, 2024-12…
# $ date_report     <date> 2025-05-26, 2025-05-26, 2025-06-02, 2025-05…
# $ group           <chr> "Syndromic ARI", "Syndromic ARI", "Syndromic…
Output Object
nowcast_cl() returns an S7 object of class nowcast_results with the following slots (access with @):
| Slot | Type | Description |
|---|---|---|
@name |
character | Timestamp identifier for the run |
@params |
list | Parameters used for nowcasting (unevaluated call) |
@time_start |
POSIXct | Sys time when function started |
@time_end |
POSIXct | Sys time when function ended |
@n_groups |
numeric | Number of groups processed |
@max_delay |
numeric | Maximum delay used |
@data |
data.frame | Original input data (required columns only) |
@completeness |
data.frame | Input data with delays and completeness columns |
@delays |
data.frame | Aggregated completeness per delay (+ modelled column if fitted) |
@models |
data.frame | Fitted models (empty if do_model_fitting = FALSE) |
@results |
data.frame | Final nowcasting predictions |
Methods Summary
-
Input Data: Ensure three core columns:
observed_value/date_of_reporting/date_of_occurrence(e.g. date_of_event / date_of_onset)
-
Calculate the
reporting_delay(=date_of_reporting-date_of_occurrence)
-
Compute the
completeness(=observed_value/true_value(approximated bylast_reported_value))
-
Aggregate the
avg_completenessfor eachreporting_delay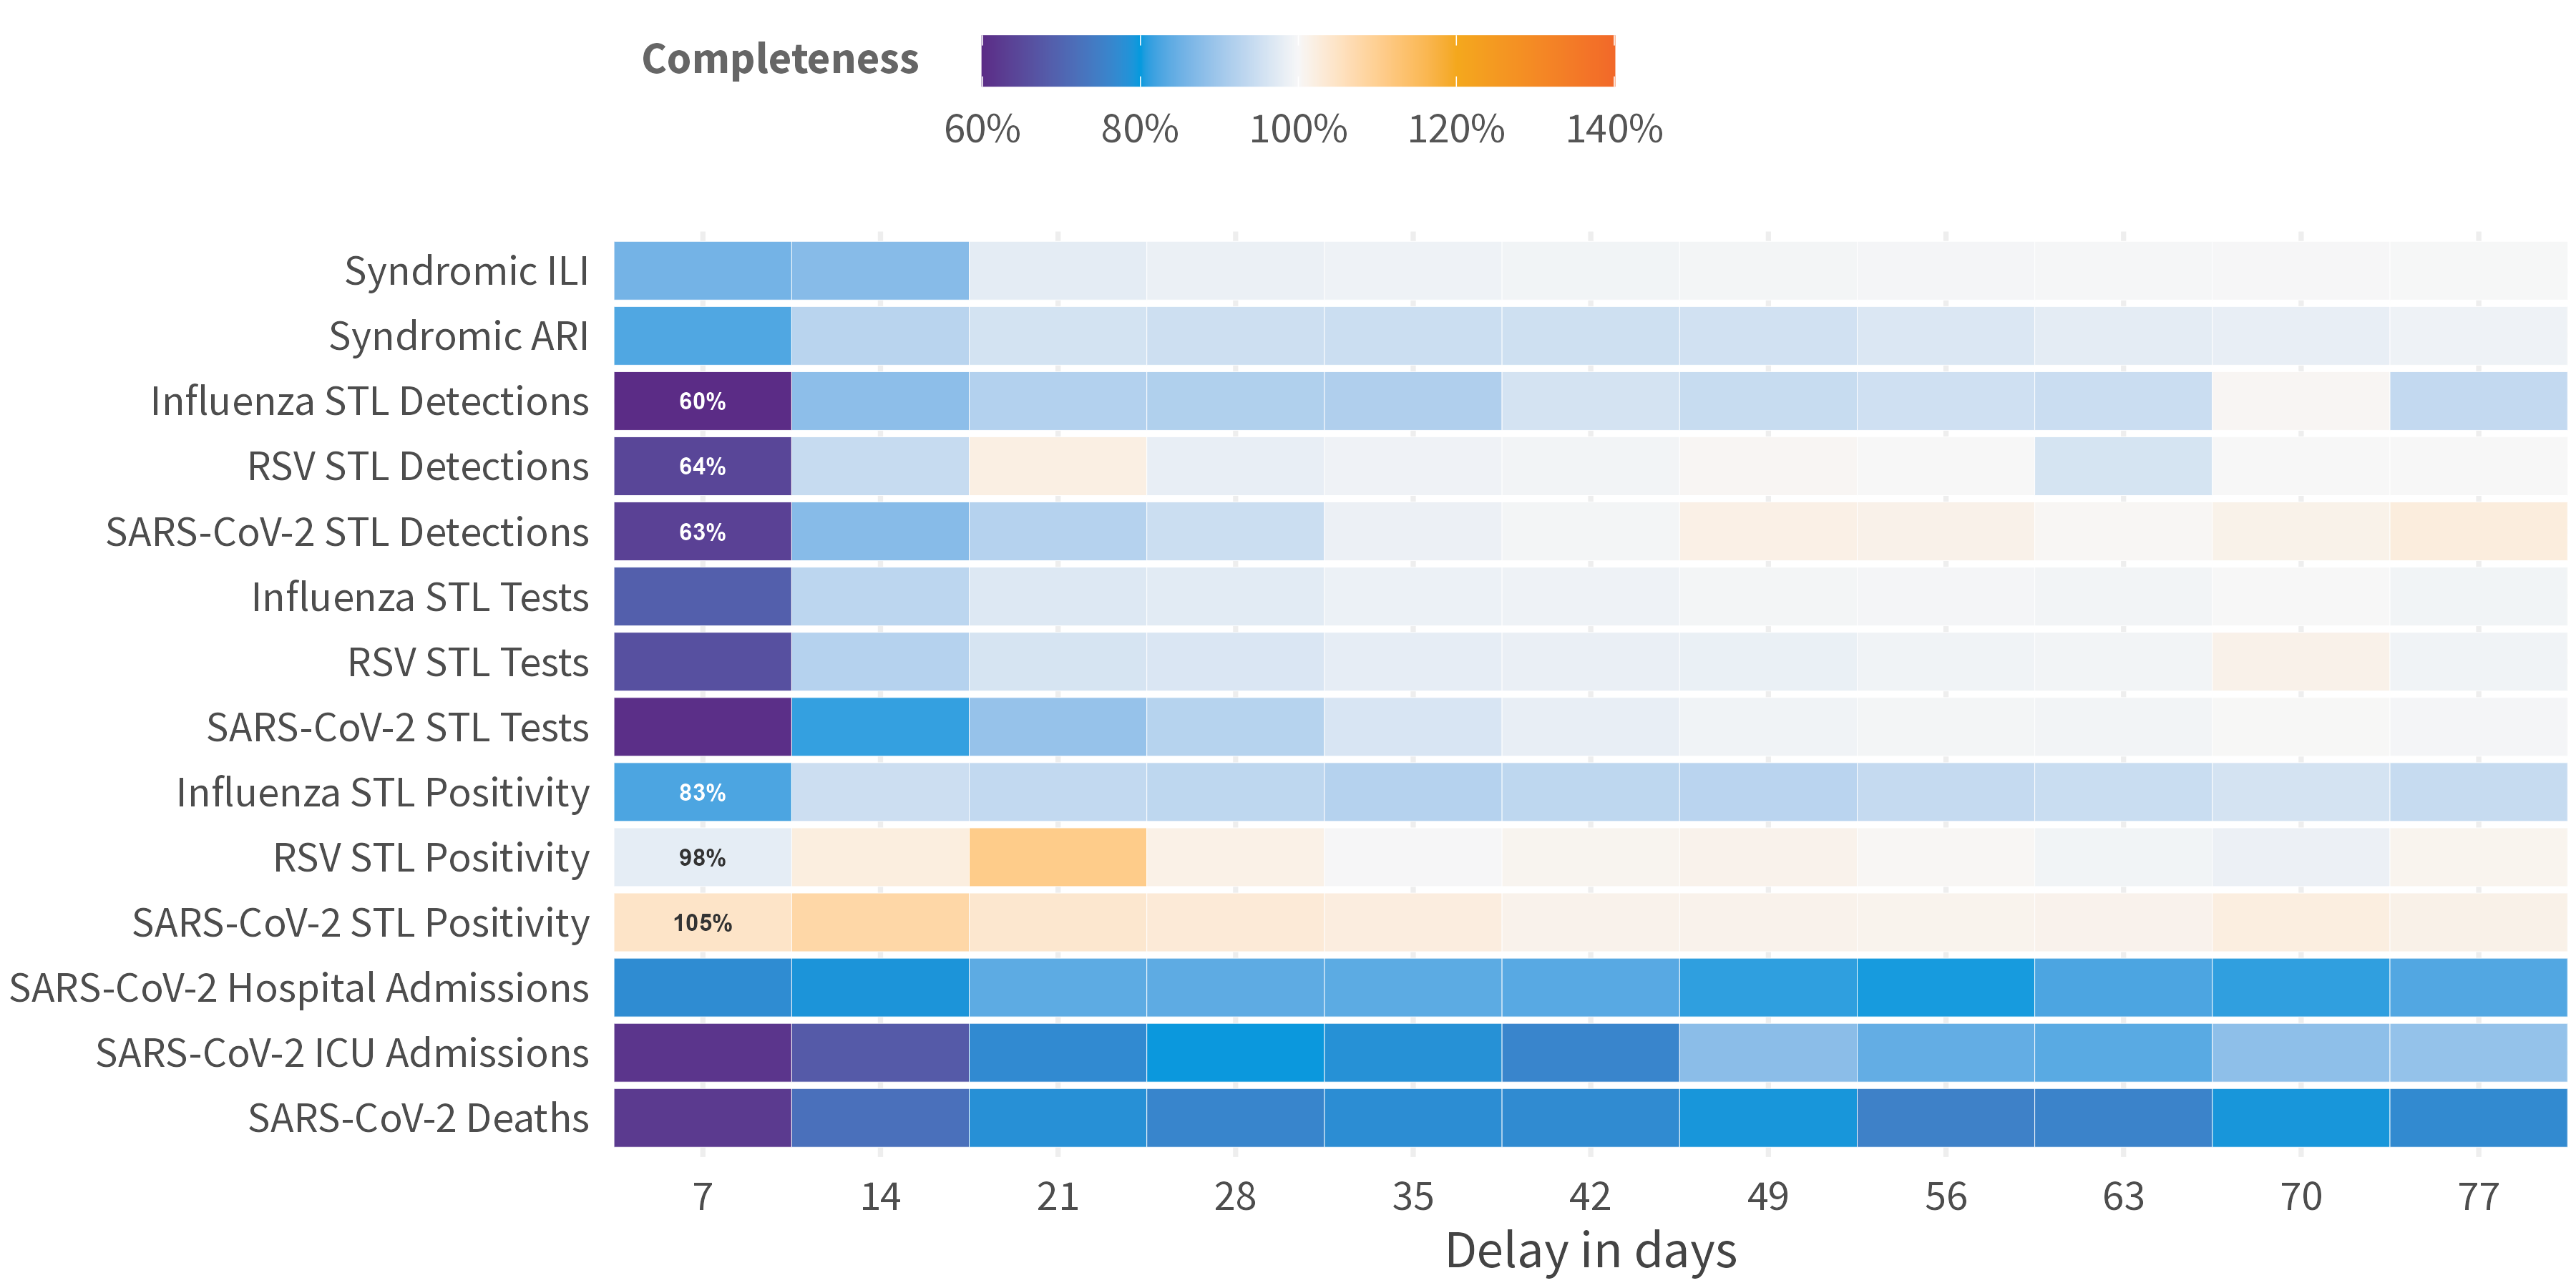
-
Optional: Fit a curve through that
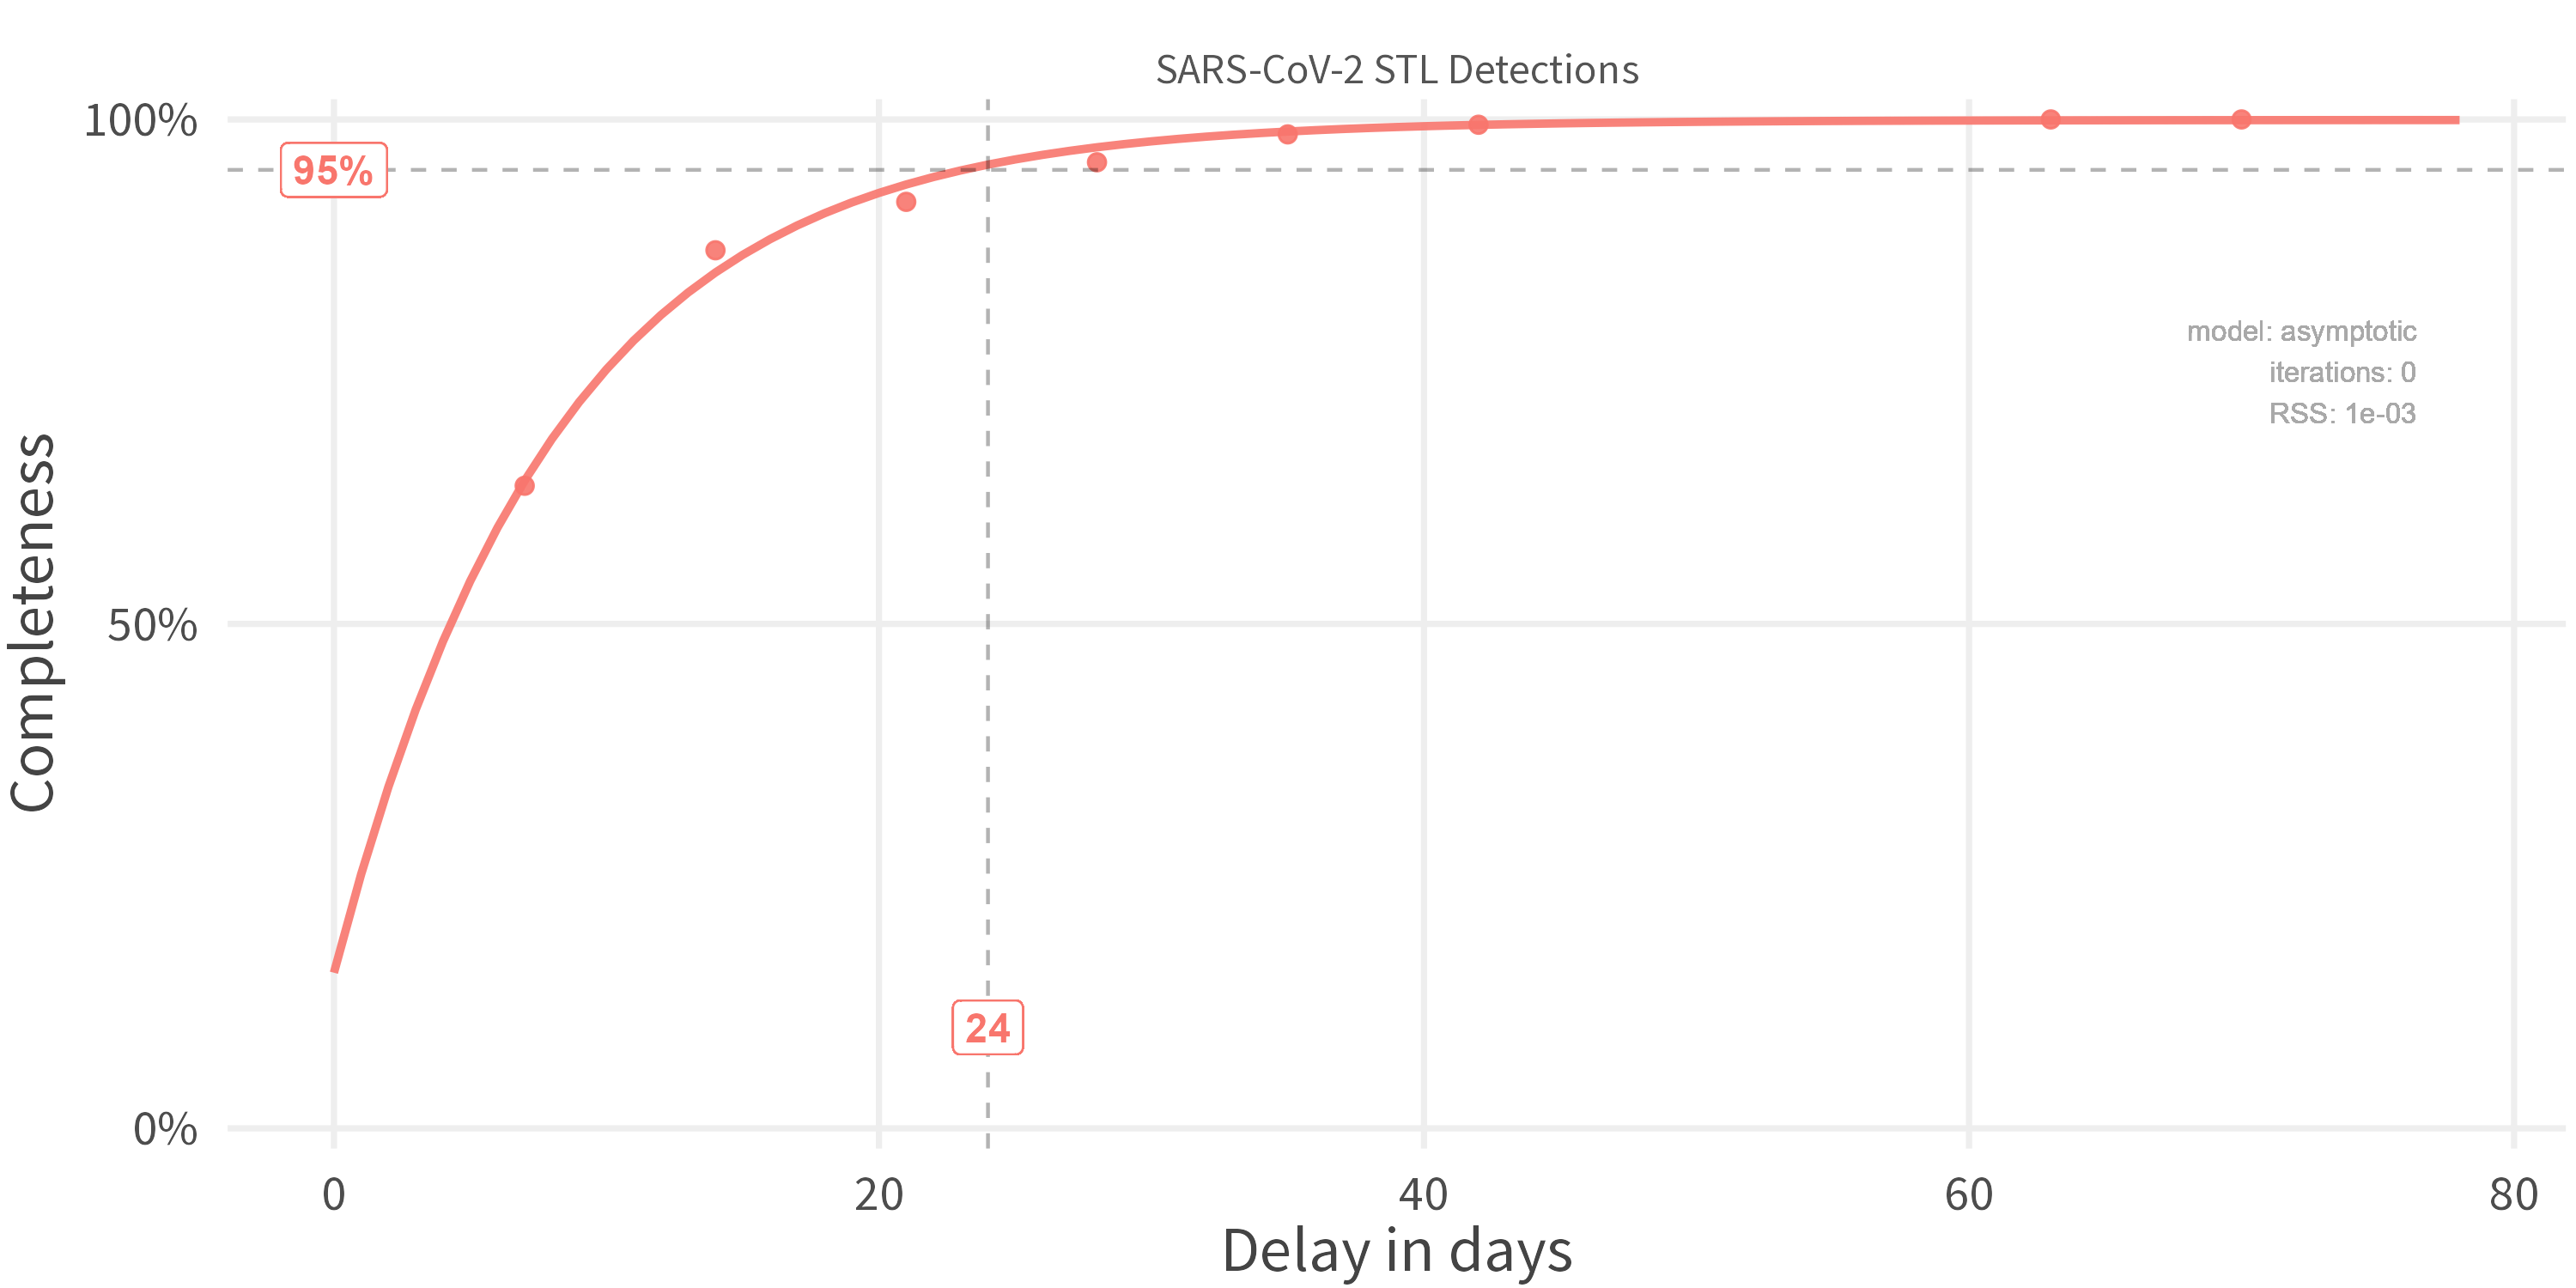
-
Apply Nowcast:
nowcast=observed_value/avg_completeness